Sometimes during the holiday season, it can feel like you are doing everything right but your ecommerce business is not thriving. This is where key performance indicators (KPIs) come into play. Ecommerce KPIs are metrics that measure various aspects of your business in numbers. Retail KPIs can track everything from marketing metrics to website performance, sales, customer retention, and more. And we all know numbers don’t lie.
Insider Intelligence predicts that ecommerce retail sales will increase by 15.5% during the holiday season in 2022. The ecommerce industry is working day and night to capture the maximum number of customers during the holiday sales.
Check out our past blog post for ideas on how to improve your customers’ ecommerce experience this holiday season.
Here is a quick discussion on choosing the right KPIs.
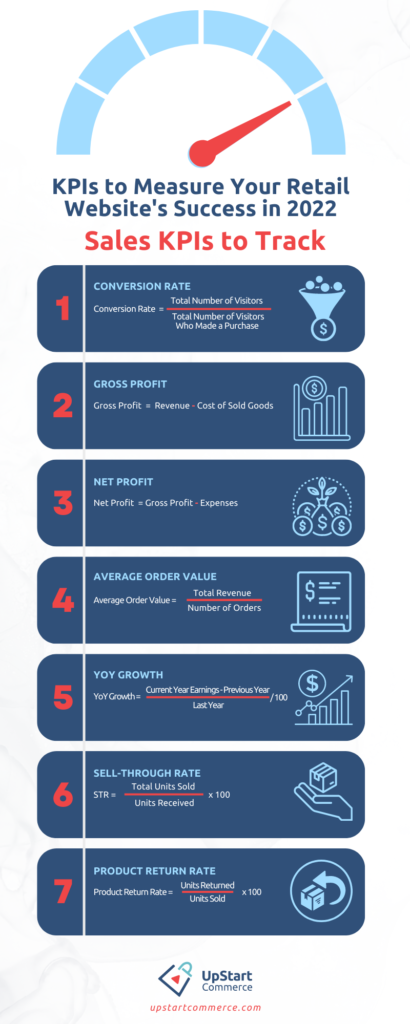
KPIs to Measure Your Retail Website’s Success in 2022
Here is a list of important KPIs to consider when measuring the success of your retail website:
Sales KPIs to Track
Below are 7 KPIs that help retail businesses understand the performance of their sales.
1. Conversion rate
This metric is one of the most important KPIs. It determines the rate at which customers are purchasing your products after visiting your website. You can understand how well your products and site are performing. Conversion rate is also very beneficial as an ecommerce metric because it gives an idea on the performance of landing pages and other online forms. Use the following formula to calculate conversion rate:
Conversion Rate = Total Number of Visitors / Total Number of Visitors Who Made a Purchase
If you are not satisfied with the number you get when calculating the conversion rate, identify areas where you can improve the website. Implement a website visitor heat map to understand where the customers lose interest or get frustrated while navigating on your website.
2. Gross Profit
This KPI shows the total profit of an ecommerce website after taking out the cost of goods sold from the generated revenue. This metric calculates the amount of money left after the products are produced and distributed. Apply the following formula to calculate the gross profit:
Gross Profit = Total Revenue – Cost of Sold Goods
If the gross profit of your ecommerce business is low, you can consider changing the vendor producing your product to reduce your costs.
Read more: 5 Ways Smart Search Technology Maximizes Profit
3. Net Profit
Net profit is the total profit an ecommerce business earns after taking out all the expenses, such as production and delivery costs, maintenance, employee salaries, and any other costs. This ecommerce metric helps you determine whether you are losing your money or growing the business. The following formula calculates net profit:
Net Profit = Gross Profit – Expenses
When starting a business, net profit is expected to be low. However, if your net profit does not increase over time, it is best to reevaluate your sales and marketing strategies and minimize expenses.
4. Average Order Value
Tracking your average order value helps you determine the average value of your customers’ carts at checkout. Knowing the average order value can help you understand the average amount your customers spend on one order. Here is how you calculate the average order value:
Average Order Value = Total Revenue / Number of Orders
To improve your AOV, you can create a minimum order amount to redeem coupons, recommend product bundles, and implement cross-selling and upselling, among other ideas.
5. YoY Growth
YoY growth helps you determine the total growth of your business compared to the previous year. Every business should ideally have a positive growth rate. Positive growth happens when your business makes more money in the current year than the previous one. Here is how you can calculate YoY growth:
YoY Growth = [(Current Year Earnings – Previous Year) / Last Year] / 100
Trading Economics states that retail sales in the US increased 8.2% YoY in September 2022. A negative percentage means that your business’s rate of growth declined instead of increased. Look back at your past year to see what made the previous year more successful than the current year. Implement changes that will help replicate the previous year’s success and try different strategies for improvements.
6. Sell-through Rate
The sell-through rate (STR) tells you the number of products you sold within a month as compared to the number of products you received from the manufacturer. Ecommerce businesses can leverage their sell-through rate to manage their inventory, identify quick-selling products, and poorly performing products. An accurate sell-through rate can also help with decreasing storage costs. Use the following formula to calculate STR:
STR = (Total Units Sold / Units Received) X 100
The sell-through rate is often calculated as a percentage. Shopify states that the average STR is between 40-80%. If a product’s STR is not where you want it to be, you can implement marketing strategies to increase sales.
7. Product Return Rate
Knowing a product’s return rate helps you determine the total number of products that customers return to your business due to reasons such as not liking the product, a damaged product, and receiving a low-quality product. Knowing this metric can help you determine which products are low performing and where improvements are needed. Here is the formula to calculate the product return rate:
Product Return Rate = (Units Returned / Units Sold) x 100
The key to reducing your company’s return rate is providing high-quality items that are accurately advertised on your website. The National Retail Foundation estimated consumers returned $428 billion in products to retailers in 2020. Encouraging customers to leave reviews and feedback on their items can help retailers identify their consumers’ pain points and where their products excel.

Retail Sales KPIs To Track in 2022
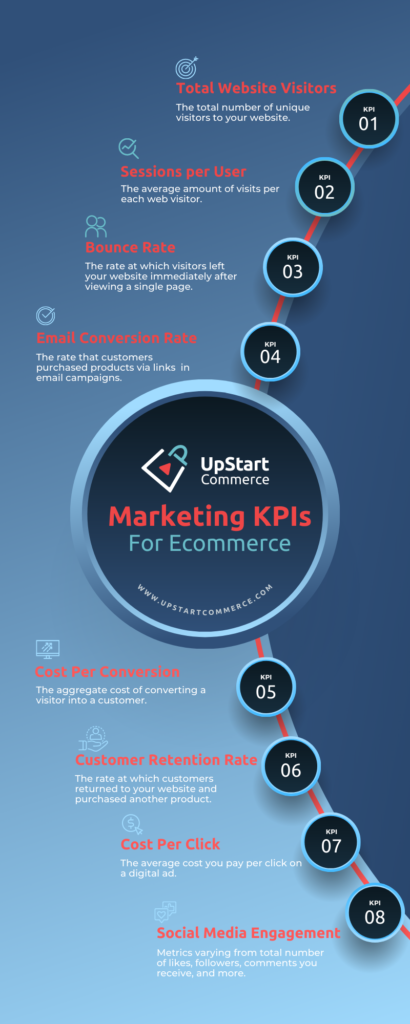
Marketing KPIs to Track
Below are 8 KPIs that help retail businesses understand the performance of their marketing efforts.
1. Total Website Visitors
The total number of unique visitors that enter your website is an important ecommerce metric to monitor. Knowing your total website visitors can help you determine patterns in traffic and measure the success of any ad campaigns.
A tool like Google Analytics can track your total website visitors.
2. Sessions per User
This KPI helps track the average amount of visits for each visitor to your retail website. This helps you understand customer retention and the quality of your website. A higher session per user calculation signifies that you are capturing return visitors. Therefore, putting potential consumers further in your marketing funnel. Here is the formula to calculate sessions per user:
Session per User = Total No. of Sessions / Total No. of Users
To increase your sessions per user, you can create retargeting marketing campaigns, strategic email campaigns, and offer promotional codes for returning visitors.
3. Bounce Rate
This retail ecommerce KPI informs you of the number of people that left your website immediately after viewing a single page. The formula to calculate this your website’s bounce rate:
Bounce Rate = Total Single Page Visitors / Total Website Visitors
Oberlo found that the average bounce rate for an ecommerce website was 47% in Q2 of 2022. Look into your website analytics and find factors that can be improved to improve your ecommerce website bounce rate. Key things to look for are bounce rate by source and bounce rate by device to see if your website is performing notably better in specific categories. Find the lower performing areas and develop an action plan to implement improvements
4. Email Conversion Rate
The rate at which customers purchase a product through the links included in email campaigns is called the email conversion rate. Here is how to calculate your email conversion rate:
Email Conversion Rate = (Total Email Conversions / Total Delivered Emails) X 100
You can understand your email marketing campaign’s effectiveness by tracking this retail KPI. Segment your audience list, personalize emails, and A/B test campaigns to improve your email conversion rate.
5. Cost Per Conversion
CPC or cost per conversion is a popular ecommerce metric. Cost per conversion measures the aggregate cost of converting a visitor into a customer. You can better determine the true cost of marketing campaigns and their effectiveness when analyzing cost per conversion.
CPC = Total Cost of Generating Traffic / Total Conversions
Increasing your cost per conversion starts with identifying low-converting keywords, adding negative keywords, and improving your landing pages. Delivering your ads to the most accurate target audience possible will lead to a better cost per conversion.
6. Customer Retention Rate
Customer retention rate (CRR) calculates the percentage of customers that returned to your website and purchased another product. Retaining loyal customers is cheaper than acquiring new consumers. Tracking this KPI is key to monitoring customer loyalty and the rate of returning to your website. Calculate your ecommerce customer retention rate using this formula:
CRR = (No. of Customers at the end of a specific time – Total New Customers) / Total Customers at the start of a specific time
Metrilo, an ecommerce analytics platform, found that the average ecommerce customer retention rate is 28.2%. Surpassing your customers’ expectations is an easy way to have a great customer retention rate. A generous return policy, offering a free gift with purchase, and quick shipping times will easily draw customers back to your site.
7. Cost Per Click
Digital ads cost money. Each time a person clicks on your Facebook or Google ad, an amount is deducted from that campaign’s ad budget on the respective platform. Cost per click or CPC helps you determine the cost you pay per click.
CPC = Total Ad Spend / Total Times the Ad is Clicked
CPC can be affected by things such as keywords, audience, and ad location. Testing different long-tail keywords, ad positions, keyword match types, and improving your ad’s quality score can reduce your cost per click. A high cost per click will quickly eat up your campaign budget.
8. Social Media Engagement
Keep an eye on the total number of likes, followers, and comments you receive on social media. This KPI helps you understand the engagement of customers your business receives on social media. Identify your top-performing post times, content, and highest engaged audience segment to better understand your consumers.
You can easily monitor these metrics on each social media’s native platform.

Marketing KPIs To Track in 2022
Keep Tracking Your Retail KPIs Regularly
The biggest mistake a retail business can make is not keeping track of its KPIs during the holiday season. It is best practice to track some of these ecommerce KPIs on a regular basis irrespective of the time of the year. Monitoring your company’s performance can help your commerce business reach new levels of success and maintain a clear picture of the high-level goals and issues.
Before the retail holiday season starts, sit down with your team, define KPIs, and track them continuously. Regularly cross-check and review your findings to ensure they provide the information you need to measure your business’s success.
Did you like what you read? Continue reading similar blogs on UpStart Commerce. Save the retail KPI infographics above to Pinterest for easy referencing!
